Interactive data visualizations of COVID-19
Telling the COVID-19 story through numbers. Includes maps, charts, graphics, models and projections.
Coronavirus disease 2019 (COVID-19): Epidemiology update
Number and rate of active, recovered and total cases, tests and deaths over time for province and territories and health regions.
2022-07-15
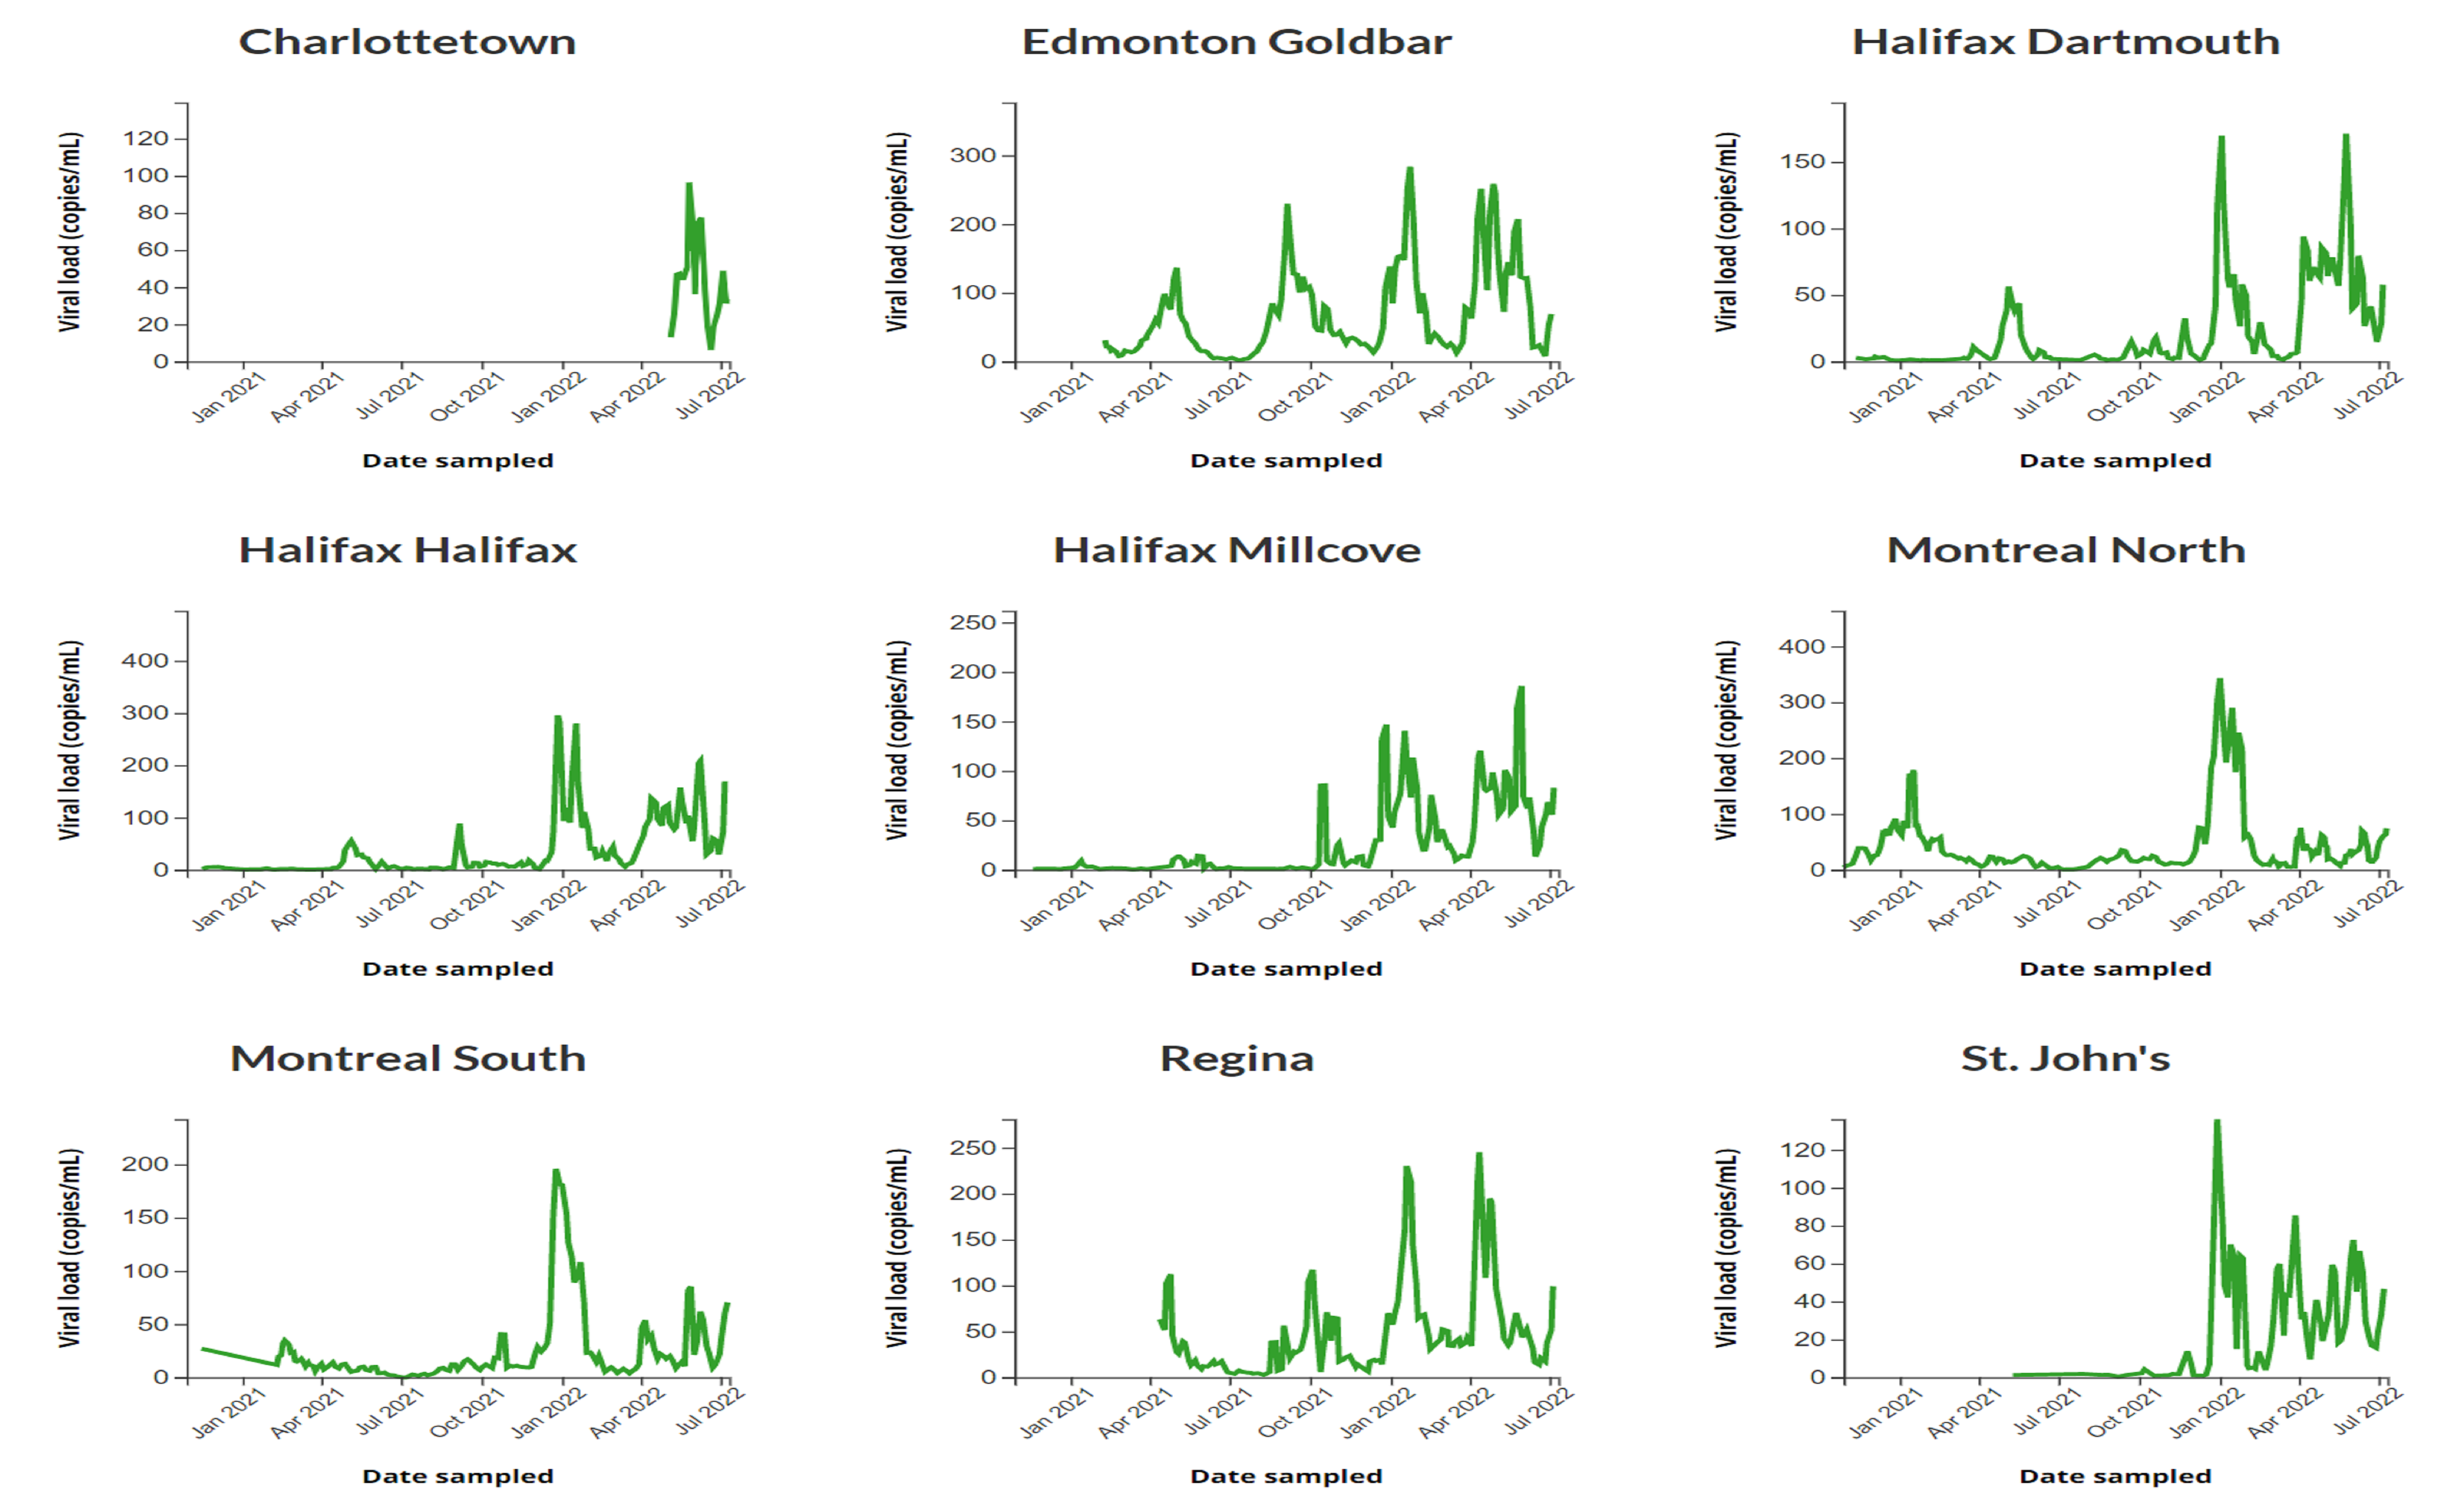
COVID-19 wastewater surveillance dashboard
trend data about the levels of COVID-19 in the wastewater (sewage) of different communities and settings across Canada.
2022-07-15
View Download Viral data in .csv format Download Trend data in .csv format
COVID-19 vaccine doses distributed in Canada
Weekday updates of interactive data map of COVID-19 vaccines distributed by province and territory.
2022-07-14
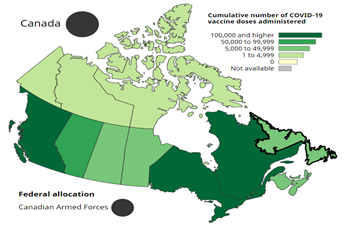
COVID-19 vaccine administration in Canada
Daily interactive data map of COVID-19 vaccines administered in Canada.
2022-07-18
COVID-19 vaccination coverage in Canada
Monthly report of COVID-19 vaccination coverage in Canada.
2022-06-27
COVID-19 vaccine safety in Canada
Monthly report of information about any adverse events following immunization (AEFI) that individuals have reported after receiving a COVID-19 vaccine in Canada. These adverse events are not necessarily related to the vaccine.
2022-07-08
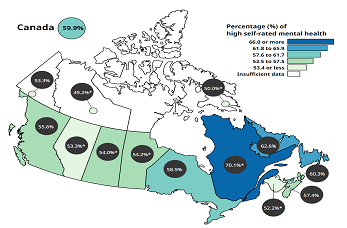
Map of Canadian mental health during the COVID-19 pandemic
Interactive data tool that shows key mental health indicators and risk factors by geography.
2022-06-20
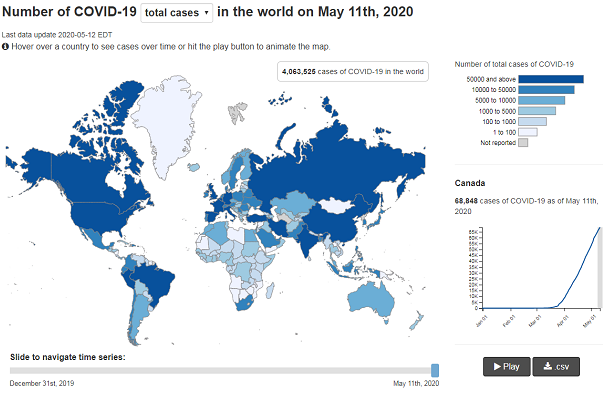
Interactive data visualization of COVID-19 in the world
Interactive data map of COVID-19 cases around the world. Shows number of cases and deaths by country over time.
2022-06-15

COVIDTrends
COVIDTrends is a tool that provides summary data about COVID-19 in your area. When you search by municipality (city, town), or by the first 3 characters of your postal code, data from your health region will appear.
2021-01-25

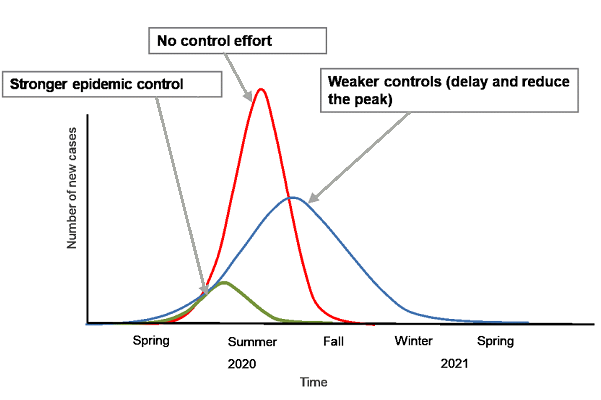
Epidemic curve
Chart showing the epidemic curve for COVID-19 in Canada.
2020-05-17
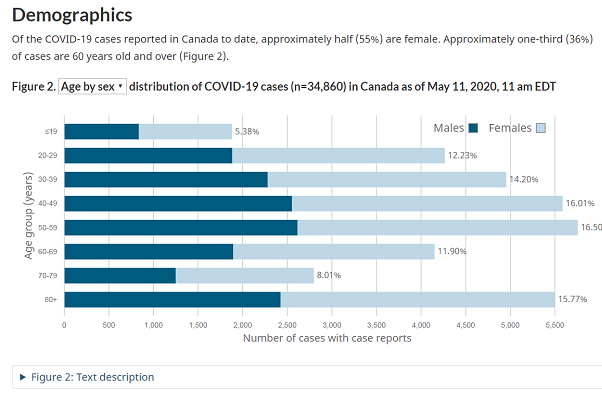
Demographics
Chart showing the age and sex of COVID-19 cases in Canada.
2020-05-17
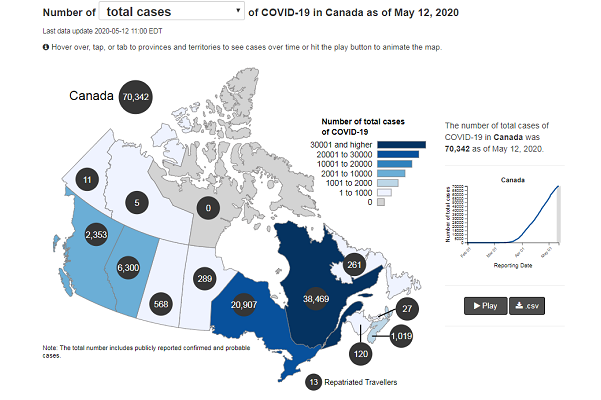
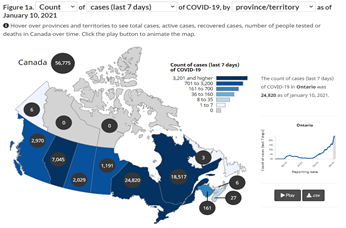
Interactive data visualization of COVID-19 in Canada
Interactive data map of COVID-19 cases across Canada. Shows number of active, recovered and total cases, tests and deaths over time for province and territories.
2021-01-11
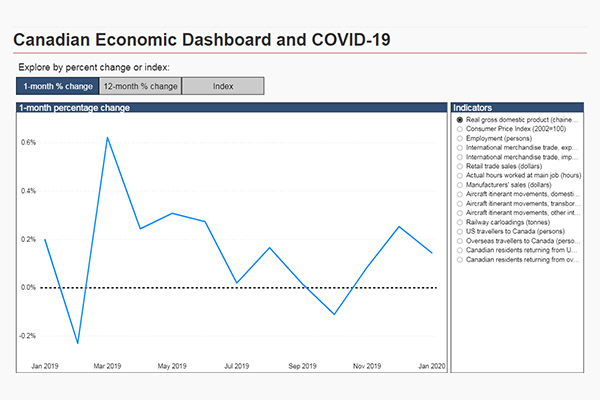
Canadian Economic Dashboard
Data for tracking the impacts of COVID-19 on economic activity in Canada.
2020-05-17
Data and modelling
Using data and modelling to guide public health decisions.
2020-05-17