Data Visualization
Looking for the story in the numbers? Browse our curated collection of public health infographics, infobytes, and other data visualizations.
Featured Data Visualization
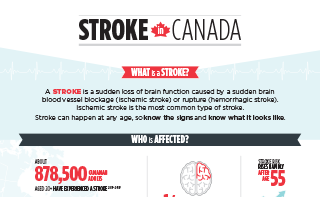
Stroke in Canada Infographic
A stroke is a sudden loss of brain function caused by a sudden brain blood vessel blockage or rupture. Stroke can happen at any age, so know the signs and know what it looks like.
2022-07-28
Infographics & Infobytes
Heart Disease in Canada Infographic
Also known as ischemic heart disease or coronary heart disease, heart disease refers to the buildup of plaque in the heart's arteries that could lead to a heart attack, heart failure, or death.
2022-07-28

Autism Spectrum Disorder- Highlights from the Canadian Survey on Disability Infographic
Autism spectrum disorder (ASD) refers to a range of conditions that can include impairments in speech, non-verbal communication, and social interactions combined with restricted and repetitive behaviours, interests or activities. Each person with ASD is unique and the term “spectrum” refers to the wide variation in strengths and challenges reflected among those with the disorder. In light of this, support needs vary by individual.
2018-06-05

Multiple Sclerosis in Canada Infographic
Multiple sclerosis (MS) is a disease of the central nervous system (CNS). The immune system attacks myelin (protective covering of the nerves) in the brain, spinal cord, and optic nerves, which disrupts communication between the CNS and the rest of the body. MS is unpredictable, often occurring in a pattern of relapses and remissions. There is currently no cure for MS, but treatments are available to decrease the frequency and severity of relapses and to ease MS symptoms.
2018-06-05

Are Canadian Children Getting Enough Sleep? Infographic
To be as healthy as possible, children need adequate night time sleep. Current guidelines recommend 9–11 hours of sleep/night for children ages 5–13 years old, and 8–10 hours of sleep/night for children 14–17 years old. But 1 in 4 children are NOT getting enough sleep.
2018-05-17
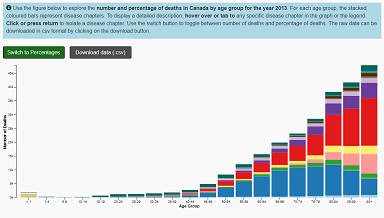
Big Picture Mortality in Canada Interactive
Every year more than 250,000 Canadians die of various causes. Each death becomes part of a vital statistics mortality dataset.
2018-05-04
Dementia in Canada Infographic
Dementia is the loss of mental function affecting daily activities, caused by brain diseases and brain injuries. Alzheimer's disease is the most common cause of dementia.
2017-06-20

Asthma in Canada Interactive
Asthma is one of the most common chronic respiratory diseases in Canada. It affects Canadians of all ages, but younger Canadians are disproportionately affected. Symptoms of asthma include shortness of breath, wheezing, coughing, and chest tightness.
2018-05-01

Obesity in Canadian Adults Interactive
Obesity is at epidemic levels around the world in both children and adults. Although adult obesity in Canada has been relatively steady since 2004, the percentage of adults who are obese today is twice as high as it was in 1978-1979.
2017-04-25

Concussion & Brain Injuries in Canadian Children and Youth Interactive
Many sports-related head injuries including concussions are preventable - it’s about playing smart and limiting the risk of head injuries while being active.
2017-01-12

Towards a Healthier Canada (2015) Infographic
Important efforts are underway to help make social and physical environments where children live, learn and play more supportive of physical activity and healthy eating.
2016-01-22
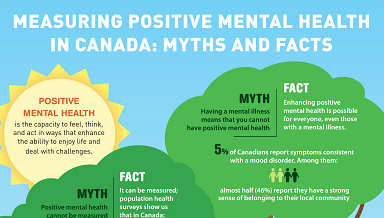
Measuring Positive Mental Health in Canada: Myths and Facts Infographic
The Public Health Agency of Canada is working to identify, organize, and present data on positive mental health outcomes, and protective and risk factors.
2017-01-24

Positive Mental Health Surveillance Conceptual Framework Infographic
Conceptual framework contains 5 outcome indicators and 25 risk and protective determinant indicators.
2015-01-29
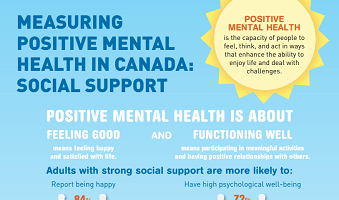
Measuring Positive Mental Health in Canada: Social Support Infographic
Why is social support so important to positive mental health? Because it contributes to feeling good and functioning well.
2016-05-03
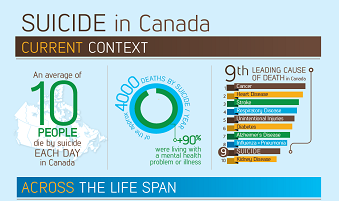
Suicide in Canada Infographic
This infographic provides an overview of current data on suicide, by age and sex across the lifespan, and data on hospitalizations for self-inflicted injury.
2016-06-16

Be Active, Play Smart Interactive
We all want to be healthy. Part of a healthy lifestyle is being active. But the stats say that we can do better. Hold on - don't count yourself out! There's still time to join the game.
2016-01-10
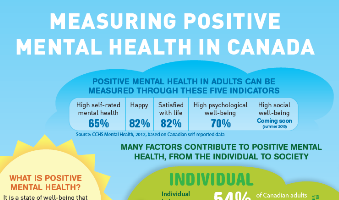
Measuring Positive Mental Health in Canada Infographic
Positive mental health is a state of well-being that allows us to "feel, think, and act in ways that enhance our ability to enjoy life and deal with the challenges we face."
2015-01-21

Towards a Healthier Canada (2013) Infographic
Important efforts are underway to help make social and physical environments where children live, learn and play more supportive of physical activity and healthy eating.
2015-06-24
