
Respiratory viruses: Wastewater monitoring dashboard: Respiratory virus activity
This dashboard provides data about respiratory virus levels, including SARS-CoV-2 (COVID-19), influenza (flu) and respiratory syncytial virus (RSV) in wastewater (sewage) in Canada.
- Last updated: 2024-07-23
- Download page in PDF format
We update this information on Tuesdays and Fridays at 12:00 noon Eastern Time. In the event of a holiday, we update on the next business day. Data at some sites may lag slightly, due to the time it takes to transport and analyze samples. This report was last updated on July 19, 2024 with data up to and including November 2, 2023.
Delay in the update schedule
The data dashboard update is delayed while we resolve a technical issue.
On this page
- National viral activity levels
- National overview
- Interpreting wastewater data
- Canadian wastewater monitoring dashboards and websites for respiratory viruses
- Download the data
National viral activity levels
These tiles summarize recent overall activity levels of COVID-19, flu and RSV based on data from wastewater sites across Canada.
of COVID-19 is {{}}
of Flu A is {{}}
of Flu B is {{}}
of RSV is {{}}
About these data tiles
The activity levels of COVID-19, flu and RSV are determined using the following activity level index. For more details on the calculation of signal level and signal trend metrics, please refer to the technical notes.
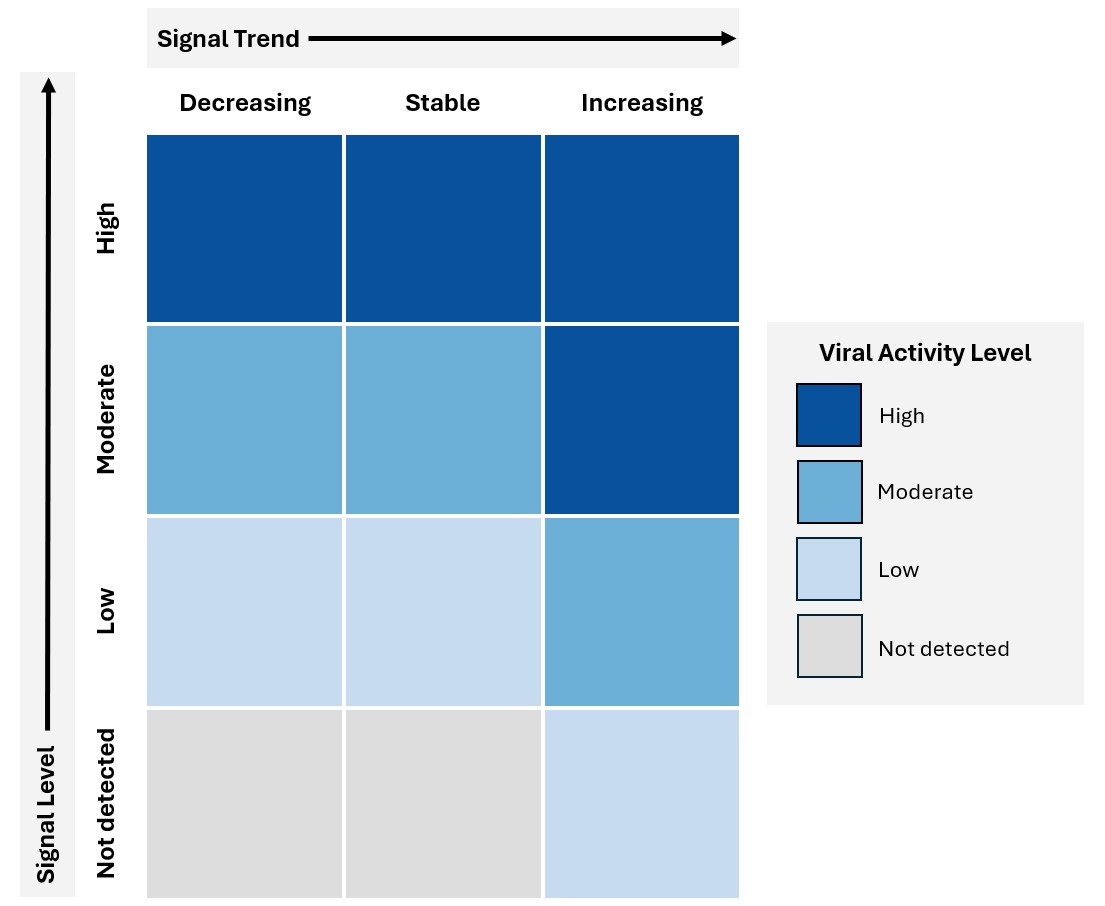
- High activity level means:
- viral signals are high compared to values over the past year, or
- viral signals are moderate compared to values over the past year, and the recent trend is increasing
- Moderate activity level means:
- viral signals are moderate compared to values over the past year, and the recent trend is decreasing or stable, or
- viral signals are low compared to values over the past year and the recent trend is increasing
- Low activity level means:
- viral signals are low compared to values over the past year, and the recent trend is decreasing or stable, or
- viral signals are below the threshold for detection, and the recent trend is increasing
- No detection activity level means:
- viral signals are below the threshold for detection and the recent trend is decreasing or stable
National overview
Figure 1. Current wastewater viral activity levels in Canada
Zoom or tap regions to see respiratory virus activity levels in Canada. Map data is available in .csv format.
Data from {} sites are included on this dashboard.
Figure 1: Text description
Notes
- This information is based on wastewater samples submitted for testing to the National Microbiology Laboratory or a participating partner laboratory.
- The National Microbiology Laboratory conducts testing for over 70 sites across Canada, with partner laboratories conducting testing for a number of additional sites. Data from 60 sites are included on this dashboard. Site selection and the decision to publish results on the dashboard is always at the discretion of provinces, territories, and municipalities.
- Sites with no available data on wastewater signal trends and levels are marked as NA (not available).
- NA1 indicates newly onboarded sites with less than 12 months of data available and are currently awaiting baseline data. Newly onboarded sites need approximately 12 months of wastewater data before an accurate activity level metric can be determined.
- NA2 indicates sites that have recently stopped sampling with and have no recent data available or sites that have no data available because they're not being sampled. The specific cut-off is when the site hasn’t submitted a minimum of 3 samples in the past 5 weeks.
Interpreting wastewater data
The wastewater dashboard shows the concentration of COVID-19, flu, and RSV in wastewater samples from different sites. The solid line of the graphs shows the population-weighted 7-day rolling average of the viral load for each site. We calculate the 7-day rolling average by averaging the viral loads from each sampling event with the previous 6 sampling events.
The grey shaded area of each graph shows the minimum and maximum COVID, flu and RSV signals of each EpiWeek since the beginning of surveillance based on available data. Use the hover option of each graph to see the daily value, as well as historical minimum and maximum values. Use caution when interpreting daily and short-term changes in viral load, as the wastewater signal can change from day to day. An ongoing increase or decrease in the viral load is more reliable for indicating trends. Any breaks in trend lines of graphs are due to limited data for that particular time period.
The statement above the graphs summarize the current activity level based on COVID-19, flu and RSV wastewater signals at the regional level. If the wastewater activity levels are high, this may indicate a high level of COVID-19, flu or RSV in your community. It's important to pay attention to public health alerts and to follow public health advice.
Instructions
The data throughout the page changes to reflect the date range and respiratory virus selected below. To select a date range, use the drop-down menu, the slider, or type the dates directly using the From and To boxes. Use the drop-down menu to select the specific respiratory virus to display. Use the drop-down menu to select the province or territory and municipalities to display.
Figure 2. Trend graph of 7-day rolling average of viral load in wastewater, as of July 23, 2024
Selected regions:
Table 2. 7-day rolling average of COVID-19 viral load in wastewater, in epidemiological season as of July 23, 2024
Figure 2: Text description
Notes
- The date corresponding to an epidemiological week varies by year and may not align across respiratory seasons. The dates from the 2023-2024 respiratory season are used as reference for graphs comparing all respiratory seasons.
- Sites with no available data on wastewater signal trends and levels are marked as NA (not available).
- NA1 indicates newly onboarded sites with less than 12 months of data available and are currently awaiting baseline data. Newly onboarded sites need approximately 12 months of wastewater data before an accurate activity level metric can be determined.
- NA2 indicates sites that have recently stopped sampling with and have no recent data available or sites that have no data available because they're not being sampled. The specific cut-off is when the site hasn’t submitted a minimum of 3 samples in the past 5 weeks.
Canadian wastewater monitoring dashboards and websites for respiratory viruses
These dashboards and websites are led by provincial, territorial and academic partners across Canada.
For corrections or additions, please contact us by email: nmlwastewater@phac-aspc.gc.ca.
Download the data
- Date modified: