First Nations and Inuit Health and Wellness Indicators

The First Nations and Inuit Health and Wellness Indicators provide an overview of some key facets of the health of First Nations people and Inuit. These indicators are grouped into four domains - demographics, health status and outcomes, determinants of health, and health system performance. In addition to each indicator, some interpretive text is provided.

For a quick overview of the indicators, click on any of the four domains below. A list of all indicators within the domain will be displayed. Additionally, a detailed description of each can be obtained by clicking on the “Description” link next to each indicator. The most recent version of the FNIHB Quick Stats is also available in a printer-friendly format.

The Constitution recognizes three main groups of Indigenous peoples in Canada: First Nations, Métis and Inuit. Data for these groups are also available from the Public Health Agency’s Health Inequalities Data Tool edition 2017 on the Public Health Infobase website. Data from the First Nations and Inuit Health and Wellness Indicators are not comparable with data for similar indicators in the Health Inequalities Data Tool edition 2017 because different data sources, populations and methodologies have been used.

  • Most data here are for the First Nations population living on-reserve. Similarly, Inuit data are not comparable because for the most part, data here are for Inuit living in Inuit Nunangat, the Inuit homelandFootnote 1.
  • Survey-based First Nations and Inuit Health and Wellness Indicators are largely populated with data from the First Nations Regional Health Survey (RHS) and the Aboriginal Peoples Survey (APS).
  • Some First Nations and Inuit Health and Wellness Indicators are populated with group-specific data from record linkages. Record linkages bring together information from two or more data sources to create one richer, more detailed database.
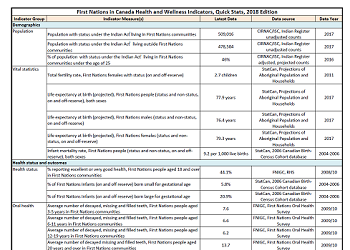
First Nations Quick Stats is also available in a printer-friendly format (PDF document). For an accessible equivalent, please use the table below.

First Nations Quick Stats (.pdf) are also available in a printer-friendly format

Inuit Quick Stats is also available in a printer-friendly format (PDF document). For an accessible equivalent, please use the table below.

Inuit Quick Stats (.pdf) are also available in a printer-friendly format

Quick Stats Overview

For more information about each indicator, click on the domains below:

First Nations

Demographics
Indicator Group Indicator Measure(s) Latest Data Data SourceData Year Description
Population Population with status under the Indian Act living in First Nations communities 509,016 CIRNAC/ISC, Indian Register unadjusted counts 2017 Description of Population with status under the Indian Act living in First Nations communities
Population Population with status under the Indian Act living outside First Nations communities 478,504 CIRNAC/ISC, Indian Register unadjusted counts 2017 Description of Population with status under the Indian Act living outside First Nations communities
Population % of population with status under the Indian Act living in First Nations communities under the age of 25 46% CIRNAC/ISC, Indian Register adjusted, projected counts 2016 Description of % of population with status under the Indian Act living in First Nations communities under the age of 25
Vital statistics Total fertility rate, First Nations females with status (on and off-reserve) 2.7 children StatCan, Projections of Aboriginal Population and Households 2011 Description of Total fertility rate, First Nations females with status (on and off-reserve)
Vital statistics Life expectancy at birth (projected), First Nations people (status and non-status, on and off-reserve), both sexes 77.9 years StatCan, Projections of Aboriginal Population and Households 2017 Description of Life expectancy at birth (projected), First Nations people (status and non-status, on and off-reserve), both sexes
Vital statistics Life expectancy at birth (projected), First Nations males (status and non-status, on and off-reserve) 76.4 years StatCan, Projections of Aboriginal Population and Households 2017 Description of Life expectancy at birth (projected), First Nations males (status and non-status, on and off-reserve)
Vital statistics Life expectancy at birth (projected), First Nations females (status and non-status, on and off-reserve) 79.3 years StatCan, Projections of Aboriginal Population and Households 2017 Description of Life expectancy at birth (projected), First Nations females (status and non-status, on and off-reserve)
Vital statistics Infant mortality rate, First Nations people (status and non-status, on and off-reserve), both sexes 9.2 per 1,000 live births StatCan, 2006 Canadian Birth-Census Cohort database 2004-2006 Description of Infant mortality rate, First Nations people (status and non-status, on and off-reserve), both sexes
Health Status and Outcomes
Indicator Group Indicator Measure(s) Latest Data Data SourceData Year Description
Health status % reporting excellent or very good health, First Nations people aged 18 and over in First Nations communities 44.1% FNIGC, RHS 2008/10 Description of % reporting excellent or very good health, First Nations people aged 18 and over in First Nations communities
Health status % of First Nations infants (on and off reserve) born small for gestational age 5.8% StatCan, 2006 Canadian Birth-Census Cohort database 2004-2006 Description of % of First Nations infants (on and off reserve) born small for gestational age
Health status % of First Nations infants (on and off reserve) born large for gestational age 20.9% StatCan, 2006 Canadian Birth-Census Cohort database 2004-2006 Description of % of First Nations infants (on and off reserve) born large for gestational age
Oral health Average number of decayed, missing and filled teeth, First Nations people aged 3-5 years in First Nations communities 7.6 FNIGC, First Nations Oral Health Survey 2009-10 Description of Average number of decayed, missing and filled teeth, First Nations people aged 3-5 years in First Nations communities
Oral health Average number of decayed, missing and filled teeth, First Nations people aged 6-11 years in First Nations communities 6.6 FNIGC, First Nations Oral Health Survey 2009-10 Description of Average number of decayed, missing and filled teeth, First Nations people aged 6-11 years in First Nations communities
Oral health Average number of decayed, missing and filled teeth, First Nations people aged 12-19 years in First Nations communities 6.2 FNIGC, First Nations Oral Health Survey 2009-10 Description of Average number of decayed, missing and filled teeth, First Nations people aged 12-19 years in First Nations communities
Oral health Average number of decayed missing and filled teeth, First Nations people aged 20 years and over in First Nations communities 13.7 FNIGC, First Nations Oral Health Survey 2009-10 Description of Average number of decayed missing and filled teeth, First Nations people aged 20 years and over in First Nations communities
Infectious disease Rate of tuberculosis, First Nations people with status in First Nations communities 26.6 per 100,000 population (3 yr. average) PHAC, CTBRS 2014/2016 Description of Rate of tuberculosis, First Nations people with status in First Nations communities
Infectious disease Rate of newly reported cases of HIV among First Nations people on and off-reserve 20.3 per 100,000 population (3 yr. average) PHAC, Canadian HIV/AIDS Reporting System 2013/2015 Description of Rate of newly reported cases of HIV among First Nations people on and off-reserve
Chronic disease % reporting having been diagnosed with heart disease, First Nations people aged 18 and over in First Nations communities 4.2% FNIGC, RHS 2015/16 Description of % reporting having been diagnosed with heart disease, First Nations people aged 18 and over in First Nations communities
Chronic disease % reporting having been diagnosed with the effects of stroke, First Nations people aged 18 and over in First Nations communities 1.4% FNIGC, RHS 2015/16 Description of % reporting having been diagnosed with the effects of stroke, First Nations people aged 18 and over in First Nations communities
Chronic disease % reporting having been diagnosed with high blood pressure, First Nations people aged 18 and over in First Nations communities 17.2% FNIGC, RHS 2015/16 Description of % reporting having been diagnosed with high blood pressure, First Nations people aged 18 and over in First Nations communities
Chronic disease Hospitalization rate for circulatory disease, First Nations people in First Nations communities 991 per 100,000 population StatCan, Census-Discharge Abstract Database linkage 2006/07 - 2008/09 Description of Hospitalization rate for circulatory disease, First Nations people in First Nations communities
Chronic disease % reporting having been diagnosed with type 2 diabetes, First Nations people aged 18 and over in First Nations communities 12.9% FNIGC, RHS 2008/10 Description of % reporting having been diagnosed with type 2 diabetes, First Nations people aged 18 and over in First Nations communities
Chronic disease Hospitalization rate for type 2 diabetes, First Nations people in First Nations communities 366 per 100,000 population StatCan, Census-Discharge Abstract Database linkage 2006/07 - 2008/09 Description of Hospitalization rate for type 2 diabetes, First Nations people in First Nations communities
Injury Hospitalization rate for unintentional injury, First Nations people in First Nations communities 836 per 100,000 population StatCan, Census-Discharge Abstract Database linkage 2006/07 - 2008/09 Description of Hospitalization rate for unintentional injury, First Nations people in First Nations communities
Mental health Hospitalization rate for intentional self-harm, First Nations people in First Nations communities 146 per 100,000 population StatCan, Census-Discharge Abstract Database linkage 2006/07 - 2008/09 Description of Hospitalization rate for intentional self-harm, First Nations people in First Nations communities
Mental health Hospitalization rate for a depressive episode, First Nations people in First Nations communities 84 per 100,000 population StatCan, Census-Discharge Abstract Database linkage 2006/07 - 2008/09 Description of Hospitalization rate for a depressive episode, First Nations people in First Nations communities
Determinants of Health
Indicator Group Indicator Measure(s) Latest Data Data Source Data Year Description
Person-related factors (individual and behavioural) % overweight (self-reported), First Nations people aged 18 and over in First Nations communities 34.2% FNIGC, RHS 2008/10 Description of % overweight (self-reported), First Nations people aged 18 and over in First Nations communities
Person-related factors (individual and behavioural) % obese (self-reported), First Nations people aged 18 and over in First Nations communities 40.2% FNIGC, RHS 2008/10 Description of % obese (self-reported), First Nations people aged 18 and over in First Nations communities
Person-related factors (individual and behavioural) % reporting drinking 5 or more alcoholic drinks on one occasion at least once a month, First Nations people aged 18 and over in First Nations communities 40.5% FNIGC, RHS 2008/10 Description of % reporting drinking 5 or more alcoholic drinks on one occasion at least once a month, First Nations people aged 18 and over in First Nations communities
Person-related factors (individual and behavioural) % reporting smoking cigarettes daily, First Nations people aged 18 and over in First Nations communities 40.3% FNIGC, RHS 2015/16 Description of % reporting smoking cigarettes daily, First Nations people aged 18 and over in First Nations communities
Person-related factors (individual and behavioural) % reporting being physically active or moderately active in their leisure time, First Nations people aged 18 and over in First Nations communities 53.5% FNIGC, RHS 2008/10 Description of % reporting being physically active or moderately active in their leisure time, First Nations people aged 18 and over in First Nations communities
Social and economic factors % who completed high school and/or post-secondary studies, First Nations people aged 25-64 in First Nations communities 56.9% StatCan, Census 2016 Description of % who completed high school and/or post-secondary studies, First Nations people aged 25-64 in First Nations communities
Social and economic factors Unemployment rate, First Nations people aged 25-64 in First Nations communities 22.5% StatCan, Census 2016 Description of Unemployment rate, First Nations people aged 25-64 in First Nations communities
Social and economic factors Employment rate, First Nations people aged 25-64 in First Nations communities 46.8% StatCan, Census 2016 Description of Employment rate, First Nations people aged 25-64 in First Nations communities
Social and economic factors Median individual income, First Nations people aged 15 and over in First Nations communities $16,907 StatCan, Census 2015 Description of Median individual income, First Nations people aged 15 and over in First Nations communities
Social and economic factors % in a food insecure household, First Nations people aged 18 and over in First Nations communities 54% FNIGC, RHS 2008/10 Description of % in a food insecure household, First Nations people aged 18 and over in First Nations communities
Physical and environment factors % in crowded homes, First Nations people in First Nations communities 37% StatCan, Census 2016 Description of % in crowded homes, First Nations people in First Nations communities
Physical and environment factors % in dwellings requiring major repairs, First Nations people in First Nations communities 44% StatCan, Census 2016 Description of % in dwellings requiring major repairs, First Nations people in First Nations communities
Health System Performance
Indicator Group Indicator Measure(s) Latest Data Data SourceData Year Description
Access % of clients who accessed at least one Non-Insured Health Benefit per year 71% FNIHB, HICPS 2016/17 Description of % of clients who accessed at least one Non-Insured Health Benefit per year
Access % that reported that the unavailability of a doctor or nurse was a barrier to receiving health care, First Nations people aged 18 and over in First Nations communities 22.6% FNIGC, RHS 2015/16 Description of % that reported that the unavailability of a doctor or nurse was a barrier to receiving health care, First Nations people aged 18 and over in First Nations communities
Effectiveness % patients diagnosed as a new active or re-treatment case of tuberculosis (TB) who completed treatment, First Nations people in First Nations communities 92.9% PHAC, CTBRS 2014 Description of % patients diagnosed as a new active or re-treatment case of tuberculosis (TB) who completed treatment, First Nations people in First Nations communities
Prevention % up to date on measles, mumps and rubella (MMR) vaccination, First Nations children at age 2 in First Nations communities 80.4% FNIHB Program statistics 2016 Description of % up to date on measles, mumps and rubella (MMR) vaccination, First Nations children at age 2 in First Nations communities
Prevention % that had a mammogram in the past 3 years, First Nations women aged 50-74 in First Nations communities 62.8% FNIGC, RHS 2008/10 Description of % that had a mammogram in the past 3 years, First Nations women aged 50-74 in First Nations communities
Prevention % that had a pap test in the past three years, First Nations women aged 18 and over in First Nations communities 68.5% FNIGC, RHS 2015/16 Description of % that had a pap test in the past three years, First Nations women aged 18 and over in First Nations communities
Water safety % of First Nations communities that are in compliance with national water monitoring guidelines 41% FNIHB, Environmental Public Health program statistics 2013-14 Description of % of First Nations communities that are in compliance with national water monitoring guidelines
Water safety % of the recommended number of sampling weeks that public water systems in First Nations communities were monitored for bacteria 80% FNIHB, Environmental Public Health program statistics 2017 Description of % of the recommended number of sampling weeks that public water systems in First Nations communities were monitored for bacteria

Inuit

Demographics
Indicator Group Indicator Measure(s) Latest Data Data SourceData Year Description
Population Total Inuit population in Canada 65,030 StatCan, Census 2016 Description of Total Inuit population in Canada
Population Inuit population living in Inuit Nunangat 47,330 StatCan, Census 2016 Description of Inuit population living in Inuit Nunangat
Population % of Inuit living in Inuit Nunangat under the age of 25 54% StatCan, Census 2016 Description of % of Inuit living in Inuit Nunangat under the age of 25
Population Total number of Inuit communities in Canada 51 Inuit Tapiriit Kanatami 2018 Description of Total number of Inuit communities in Canada
Vital statistics Total fertility rate, Inuit females in Canada 2.8 children StatCan, Projections of Aboriginal Population and Households 2011 Description of Total fertility rate, Inuit females in Canada
Vital statistics Life expectancy at birth (projected), Inuit in Canada, both sexes 72.4 years StatCan, Projections of Aboriginal Population and Households 2017 Description of Life expectancy at birth (projected), Inuit in Canada, both sexes
Vital statistics Life expectancy at birth (projected), Inuit males in Canada 70.8 years StatCan, Projections of Aboriginal Population and Households 2017 Description of Life expectancy at birth (projected), Inuit males in Canada
Vital statistics Life expectancy at birth (projected), Inuit females in Canada 74.0 years StatCan, Projections of Aboriginal Population and Households 2017 Description of Life expectancy at birth (projected), Inuit females in Canada
Vital statistics Infant mortality rate, Inuit in Canada 12.3 per 1,000 live births StatCan, 2006 Canadian Birth-Census Cohort database 2004-2006 Description of Infant mortality rate, Inuit in Canada
Health Status and Outcomes
Indicator Group Indicator Measure(s) Latest Data Data SourceData Year Description
Health status % reporting excellent or very good health, Inuit aged 18 and over living in Inuit Nunangat 37.9% StatCan, Aboriginal Peoples Survey (APS) 2012 Description of % reporting excellent or very good health, Inuit aged 18 and over living in Inuit Nunangat
Health status % of all Inuit infants in Canada born small for gestational age 8.0% Stat Can, 2006 Canadian Birth-Census Cohort database 2004-2006 Description of % of all Inuit infants in Canada born small for gestational age
Health status % of all Inuit infants in Canada born large for gestational age 15.6% Stat Can, 2006 Canadian Birth-Census Cohort database 2004-2006 Description of % of all Inuit infants in Canada born large for gestational age
Oral health Average number of decayed, missing and filled teeth, Inuit aged 3-5 living in Inuit Nunangat 8.2 FNIHB, IOHS 2008-9 Description of Average number of decayed, missing and filled teeth, Inuit aged 3-5 living in Inuit Nunangat
Oral health Average number of decayed, missing and filled teeth, Inuit aged 6-11 living in Inuit Nunangat 7.1 FNIHB, IOHS 2008-9 Description of Average number of decayed, missing and filled teeth, Inuit aged 6-11 living in Inuit Nunangat
Oral health Average number of decayed, missing and filled teeth, Inuit aged 12-19 living in Inuit Nunangat 9.5 FNIHB, IOHS 2008-9 Description of Average number of decayed, missing and filled teeth, Inuit aged 12-19 living in Inuit Nunangat
Oral health Average number of decayed missing and filled teeth, Inuit aged 20 and over living in Inuit Nunangat 16.8 FNIHB, IOHS 2008-9 Description of Average number of decayed missing and filled teeth, Inuit aged 20 and over living in Inuit Nunangat
Infectious disease Rate of tuberculosis, Inuit in Canada 189.3 per 100,000 population (3 yr. average) PHAC, CTBRS 2014-2016 Description of Rate of tuberculosis, Inuit in Canada
Chronic disease % reporting having been diagnosed with heart disease, Inuit aged 18 and over living in Inuit Nunangat 4.0% StatCan, APS 2012 Description of % reporting having been diagnosed with heart disease, Inuit aged 18 and over living in Inuit Nunangat
Chronic disease % reporting having been diagnosed with high blood pressure, Inuit aged 18 and over living in Inuit Nunangat 11.4% StatCan, APS 2012 Description of % reporting having been diagnosed with high blood pressure, Inuit aged 18 and over living in Inuit Nunangat
Chronic disease Hospitalization rate for circulatory disease, Inuit living in Inuit Nunangat 583 per 100,000 population StatCan, Census-Discharge Abstract Database linkage 2006/07 - 2008/09 Description of Hospitalization rate for circulatory disease, Inuit living in Inuit Nunangat
Chronic disease % reporting having been diagnosed with type 2 diabetes, Inuit aged 18 and over living in Inuit Nunangat 4.0% StatCan, APS 2012 Description of % reporting having been diagnosed with type 2 diabetes, Inuit aged 18 and over living in Inuit Nunangat
Chronic disease Hospitalization rate for diabetes (all types), Inuit living in Inuit Nunangat 18 per 100,000 population StatCan, Census-Discharge Abstract Database linkage 2006/07 - 2008/09 Description of Hospitalization rate for diabetes (all types), Inuit living in Inuit Nunangat
Injury Hospitalization rate for unintentional injury, Inuit living in Inuit Nunangat 636 per 100,000 population StatCan, Census-Discharge Abstract Database linkage 2006/07 - 2008/09 Description of Hospitalization rate for unintentional injury, Inuit living in Inuit Nunangat
Mental health Hospitalization rate for intentional self-harm, Inuit living in Inuit Nunangat 226 per 100,000 population StatCan, Census-Discharge Abstract Database linkage 2006/07 - 2008/09 Description of Hospitalization rate for intentional self-harm, Inuit living in Inuit Nunangat
Mental health Hospitalization rate for a depressive episode, Inuit living in Inuit Nunangat 159 per 100,000 population StatCan, Census-Discharge Abstract Database linkage 2006/07 - 2008/09 Description of Hospitalization rate for a depressive episode, Inuit living in Inuit Nunangat
Determinants of Health
Indicator Group Indicator Measure(s) Latest Data Data SourceData Year Description
Person-related factors (individual and behavioural) % overweight (self-reported), Inuit aged 18 and over living in Inuit Nunangat 28.4% StatCan, APS 2012 Description of % overweight (self-reported), Inuit aged 18 and over living in Inuit Nunangat
Person-related factors (individual and behavioural) % obese (self-reported), Inuit aged 18 and over living in Inuit Nunangat 24.1% StatCan, APS 2012 Description of % obese (self-reported), Inuit aged 18 and over living in Inuit Nunangat
Person-related factors (individual and behavioural) % reporting drinking 5 or more alcoholic drinks on one occasion at least once a month, Inuit aged 18 and over living in Inuit Nunangat 28.3% StatCan, APS 2012 Description of % reporting drinking 5 or more alcoholic drinks on one occasion at least once a month, Inuit aged 18 and over living in Inuit Nunangat
Person-related factors (individual and behavioural) % reporting smoking cigarettes daily, Inuit aged 18 and over living in Inuit Nunangat 64.1% StatCan, APS 2012 Description of % reporting smoking cigarettes daily, Inuit aged 18 and over living in Inuit Nunangat
Social and economic factors % who completed high school and/or post-secondary studies, Inuit aged 25-64 living in Inuit Nunangat 47.1% StatCan, Census 2016 Description of % who completed high school and/or post-secondary studies, Inuit aged 25-64 living in Inuit Nunangat
Social and economic factors Unemployment rate, Inuit aged 25-64 living in Inuit Nunangat 23.1% StatCan, Census 2016 Description of Unemployment rate, Inuit aged 25-64 living in Inuit Nunangat
Social and economic factors Employment rate, Inuit aged 25-64 living in Inuit Nunangat 56.1% StatCan, Census 2016 Description of Employment rate, Inuit aged 25-64 living in Inuit Nunangat
Social and economic factors Median individual income, Inuit aged 15 and over living in Inuit Nunangat $23,485 StatCan, Census 2015 Description of Median individual income, Inuit aged 15 and over living in Inuit Nunangat
Physical and environment factors % in crowded homes, Inuit living in Inuit Nunangat 51.7% StatCan, Census 2016 Description of % in crowded homes, Inuit living in Inuit Nunangat
Physical and environment factors % in dwellings requiring major repairs, Inuit living in Inuit Nunangat 31.5% StatCan, Census 2016 Description of % in dwellings requiring major repairs, Inuit living in Inuit Nunangat
Health System Performance
Indicator Group Indicator Measure(s) Latest Data Data SourceData Year Description
Access % who saw or spoke on the phone with a family physician or nurse in the last year, Inuit aged 18 and over living in Inuit Nunangat 66.5% StatCan, APS 2012 Description of % who saw or spoke on the phone with a family physician or nurse in the last year, Inuit aged 18 and over living in Inuit Nunangat
Access % who saw a dental professional in the last year, Inuit aged 18 and over living in Inuit Nunangat 51.1% StatCan, APS 2012 Description of % who saw a dental professional in the last year, Inuit aged 18 and over living in Inuit Nunangat
Effectiveness % Inuit patients in Canada diagnosed as a new active or re-treatment case of tuberculosis (TB) who completed treatment 93.4% PHAC, CTBRS 2014 Description of % Inuit patients in Canada diagnosed as a new active or re-treatment case of tuberculosis (TB) who completed treatment

Notes

Abbreviations

  • APS, Aboriginal Peoples Survey; CIRNAC/ISC, Crown-Indigenous Relations and Northern Affairs Canada and Indigenous Services Canada; CTBRS, Canadian Tuberculosis Reporting System; DAD, Discharge Abstract Database; FNIHB, First Nations and Inuit Health Branch; FNIGC, First Nations Information Governance Centre; HICPS, Health Information and Claims Processing Services System; PHAC, Public Health Agency of Canada; RHS, Regional Health Survey; StatCan, Statistics Canada

Notes

  • Inuit Nunangat includes the Inuvialuit Settlement Region in the Northwest Territories, the territory of Nunavut, Nunavik in northern Quebec and Nunatsiavut in northern Labrador.
  • While most people registered under the Indian Act are First Nations people, a small proportion do not identify as First Nations but have status nonetheless; this includes non-First Nations women who gained status through marriage (before 1985), some non-First Nations children who gained status through adoption, and others. This number also excludes those who identify as First Nations but who are not registered.
  • Data for Inuit may not be comparable with data for similar indicators in the Public Health Infobase because of different data sources and methodologies. Data in this sheet are primarily for Inuit living in Inuit Nunangat.
  • aData for 46,000 Inuit are included with those for First Nations people. These Inuit comprise 5% of the total.
  • Data for First Nations people may not be comparable with data for similar indicators in the Public Health Infobase because of different data sources and methodologies. Data in this sheet are primarily for the First Nations population living on-reserve.
  • The terms 'on-reserve' and 'First Nations community' used interchangeably, depending on the source of the data.
  • Suggested citation: First Nations and Inuit Health Branch, Indigenous Services Canada, First Nations and Inuit in Canada Health and Wellness Indicators, Quick Stats, 2018 Edition
  • For questions or comments, please contact BranchStats_FNIHB_SPPI-StatDirGen_DGSPNI_PSPI@hc-sc.gc.ca
Date modified: