
School Active Transportation in Canadian Children and Youth:
Information on the choice of an active mode for the daily trip to school for children and youth aged 5 to 17 years living in Canada
- Last updated: 2025-08-15

The 2019 Canadian Health Survey on Children and Youth provides information on school active transportation for children and youth aged 5 to 17. School active transportation refers to the choice of an active mode for the daily trip to school.
Overall, 30.4% of children and youth report walking, biking or using other active ways to get to school. Prevalence rates vary across the country. Prevalence is the percentage of people in a population who have a condition or trait at a certain time.
Figure 1. Prevalence of school active transportation in Canadian provinces and territories.
Hover over, or click on a province or territory to see available census-metropolitan area values.
* Interpret with caution due to high sampling variability associated with this estimate.
Table 1. Prevalence of school active transportation in Canadian provinces and territories.
Figure 1: Text description
* Interpret with caution due to high sampling variability associated with this estimate.
Walking to school is highest in urban areas, and cycling is highest in small population centres. Walking and cycling to school is lowest in rural settings.
- Urban areas (walking 33.6%, cycling 2.9%)
- Small population centres (walking 26.4%, cycling 4.9%)
- Rural settings (walking 12.7%, cycling 2.2%)
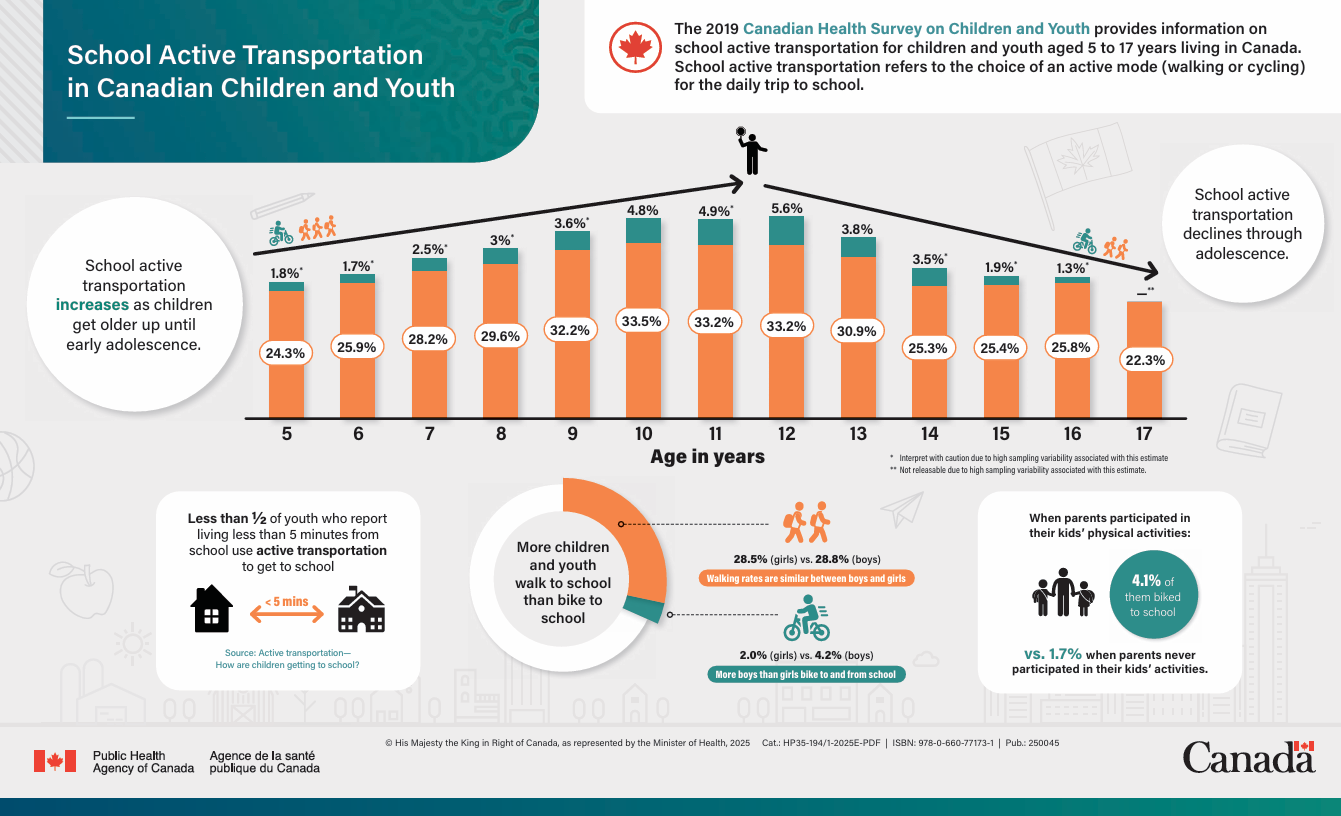
School active transportation (walking and cycling) increases as children get older, up until age 12. It then declines through adolescence.
More children and youth walk to school than bike to school. Walking rates are similar for boys and girls (28.5% girls, 28.8% boys). However, more boys than girls bike to and from school (2.0% girls, 4.2% boys).
When parents participated in their kids’ physical activities, 4.1% of them biked to school. This is in comparison to 1.7% when parents never participated in their kids’ activities.
Less than half of youth who report living less than 5 minutes from school use active transportation to get to school.
Figure 2. Prevalence of walking and cycling active transportation among Canadian children and youth according to age.
Hover over the bar graph to see the prevalence of walking and cycling active transportation among children.
* Interpret with caution due to high sampling variability associated with this estimate.
Table 2. Prevalence of walking and cycling active transportation among Canadian children and youth according to age.
Figure 2: Text description
* Interpret with caution due to high sampling variability associated with this estimate.
- Date modified: