
COVID-19 epidemiology update: Testing and variants:
- Last updated: 2024-07-04
- Download page in PDF format
Summary of COVID-19 testing and variants of concern across Canada and over time. Older versions of this report are available on the archived reports page.
This page was last updated on .
Change in report
As of October 4, 2024, this webpage will no longer be updated. Information on COVID-19 can now be found on the Canadian respiratory virus surveillance report, where it is presented along other respiratory viruses including Influenza, and RSV.
Testing in Canada
For information on respiratory viruses circulating in Canada, visit:
Presenting COVID-19 testing data with other respiratory viruses like flu and RSV allows us to make more informed decisions. This is part of our ongoing work to integrate COVID-19 and respiratory virus reporting.
Variants in Canada
All viruses change over time, including SARS-CoV-2, the virus that causes COVID-19 disease. These changes are called mutations and viruses with mutations are called variants. A percentage of all positive COVID-19 PCR test results in Canada undergo whole genome sequencing. Sequencing tells us which variant is involved in a specific case of COVID-19.
About variants and lineages
Many variants are being tracked across Canada and around the world. Some variants are classified as:
- variant under monitoring (VUM)
- is being monitored to assess its mutations and characteristics
- variant of interest (VOI)
- has mutations or characteristics of interest and is being monitored to see if they pose significant risk to public health
- variant of concern (VOC)
- has mutations and characteristics that are significant to public health
For detailed definitions, refer to SARS-CoV-2 variants: National definitions, designations, and public health actions.
Occasionally, a person may be infected with 2 different variants at the same time. The genetic material from each variant can mix to form a combined variant, referred to as a recombinant virus. Recombinant viruses inherit the properties of their parents, which can change how the virus behaves. The scientific names of the variants discussed below that start with “X” are known as recombinant variants (for example, XBB.1).
Some viruses evolve quickly, making many variants over time. To simplify tracking, variants are grouped into lineages, which are variants that share recent ancestry. For example, variant BA.1 (also known as the original Omicron variant) had several offspring lineages such as BA.1.1 and BA.1.1.1.
As of March 2023, the World Health Organization (WHO) assigns Greek letters only to VOCs, while VOIs and VUMs are referred to using established scientific nomenclature systems. There are no current VOCs in Canada because Omicron has moved to the “de-escalation” category.
A variant is “de-escalated” once it becomes clear that the variant does not pose an elevated risk to the population or that it is being replaced by newer variants.
Recent variants
This graphic shows the percentage mix of variant lineages detected in Canada through whole genome sequencing over the last 10 weeks. Each week is represented by a bar. The most dominant lineage in each week has the largest block of that week’s bar.
The first 8 weeks of the figure reflect the actual data from the National Genomic Database. The last 2 weeks reflect the nowcasted estimates. Nowcasting uses statistical models to estimate the current situation based on earlier trends. It provides estimates for the most recent weeks when the data is still accumulating and is therefore incomplete.
For more detailed information about how nowcasting works, refer to Nowcasting methods.
The numerical values for each lineage are shown in the legend, along with predictive intervals. Predictive intervals are ranges (for example, 16-19%) that indicate the confidence of each estimate. The narrower the range, the more confident we are that the prediction is accurate.
Figure 1. Weekly variant breakdown Updated: May 28, 2024, 9 am ET download weekly variant breakdown data in .csv format
You can see the numbers for each date by hovering over, tabbing to, or long-pressing any of the bars. To see a specific variant or variant grouping, click or press return. Repeat to restore the complete graph. Click on the name of the variant in the legend to reveal or hide any descendants or offshoots.
It takes time to collect, sequence and process viral genomes, so there is often a period of 2 to 3 weeks where data are still being processed. We use a nowcasting model to estimate the current variant proportions for this period.
* Includes all descendant lineages, unless otherwise specified.
† More data is needed to estimate the growth and proportion of this lineage with more certainty.
Important note: When a new lineage first emerges, its detection levels will be too low to include it in the nowcasting model. Once it is included, data will still be limited at first and its growth and overall proportion will be estimated with lower confidence. As data rolls in, the accuracy and precision of the predictions improve and the predictive interval shrinks. During periods of slow data collection, the overall proportions may be skewed and the predictions may be less accurate. Under such conditions, interpret the model projections with caution.
Figure 1: Text description
Weekly variant breakdown
Percentage of COVID-19 cases identified through whole genome sequencing, presented by variant and by week of sample collection.
| Variant grouping | Variant |
|---|
* Includes all descendant lineages, unless otherwise designated.
† The growth rate of this lineage is likely to decrease once more data accumulates.
Contributing laboratories
- National Microbiology Laboratory (NML) - supplemental sequencing for all provinces and territories
How Canada sequences SARS-CoV-2 genomes
Canada has a strong viral genomic sequencing program. Public health authorities across the country collect and analyze PCR-based test samples to identify the variant involved in each sample.
Samples are taken and tested from people suspected of having COVID-19. The material from the positive tests is sent to the laboratory, where the viral genetic material, or ribonucleic acid (RNA), is extracted. A specimen is prepared and run through a sequencing machine. The sequencing machine identifies the nucleotide bases present in the RNA sequence. This results in strings of letters that are stitched together to give the genetic code of the specimen’s variant. The genetic code of the virus is used to classify and name the variant.
Viral sequences also shows us which variants are in Canada, how they are spreading, and whether the genetic changes are impacting public health.
Figure 3. How Canada sequences SARS-CoV-2 genomes
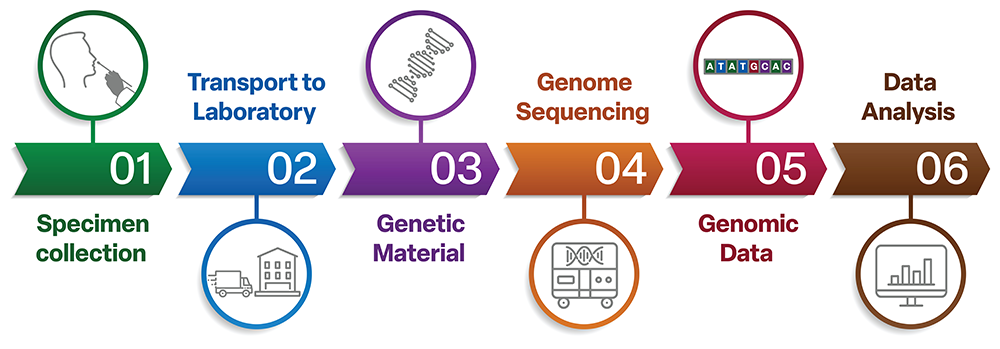
Figure 3: Text description
The diagram shows how Canada sequences SARS-CoV-2 genomes in six steps.
- Step 1: Specimen collection
- Step 2: Transport to laboratory
- Step 3: Genetic material
- Step 4: Genome sequencing
- Step 5: Genomic data
- Step 6: Data analysis
Additional COVID-19 data resources
You might also be interested in
COVID-19 wastewater surveillance dashboard
Trend data about the levels of COVID-19 in the wastewater.

COVID-19 vaccination
Number of COVID-19 vaccine doses that have been administed in Canada.
- Date modified: