
Public Awareness of Alcohol-related Harms Survey 2023
Detailed information on the public's knowledge and opinions about alcohol-related risks, educational campaigns, labelling, guidelines, and standard drink measurements.
- Last updated: 2024-01-19
Highlights
- People in Canada are generally aware that higher alcohol consumption increases the risk of certain alcohol-related harms. However, most don't know about the cancer risks at low consumption levels
- Over one-third are not familiar with the concept of a "standard drink". Among those who are, many struggle to put the concept into practice when beverages don't come in a single-serving container
- Most people agree that the labels on alcohol products should display or provide:
- the number of standard drinks (62%)
- guidance to reduce health risks (60%)
- health warnings (55%)
- More than half (59%) believe that alcohol should not be exempt from the health information labels required for other regulated products, such as tobacco and cannabis
- Most believe that such health labelling of alcohol products would help them:
- track their alcohol consumption
- think more readily about alcohol-related harms
- think about cutting back on drinking or talking to others about cutting back
Overview
In Canada, alcohol is a legal and socially accepted psychoactive substance. However, the latest scientific evidence overwhelmingly shows that any amount of alcohol poses health risksFootnote 1. Alcohol is linked to numerous health conditions, including 7 types of cancer and liver diseaseFootnote 2.
To better understand awareness of alcohol-related harms, Health Canada developed and implemented the Public Awareness of Alcohol-related Harms Survey (PAAHS). The PAAHS assesses the public's knowledge and opinions about:
- educational campaigns about alcohol
- national drinking guidelines
- standard drink measurements
- awareness of alcohol-related health risks
- health labelling of alcohol products
About the sample
Survey recipients were randomly recruited from all provinces and territories in Canada. There were 9,812 participants aged 16 years and older surveyed between February 13 and June 30, 2023. The results are weighted to match population proportions based on region, age and sex. The overall sample includes both consumers and non-consumers of alcohol. However, some survey questions were directed only to those who had previously consumed alcohol, as noted throughout the text below. A small subset of respondents (n=435) who had never consumed alcohol was excluded from those analyses that specifically focused on current and former consumers (see Definitions).
PAAHS results are organized by theme. Within each theme, factors such as age, alcohol consumption status, and sex or gender are considered.
For more details about the sample and the analysis, please refer to the Survey notes. Details about the survey methodology from the archived report are available on the Library and Archives Canada website.
Key findings by theme
Awareness of alcohol education campaigns and messages
All respondents were asked about their awareness of recent educational campaigns and public health messages about alcohol risks and safer drinking practices.
Overall, 81% of people said they had noticed alcohol-related messaging in the past 12 months, while 19% had not noticed any. There were no meaningful differences by gender, age, or alcohol consumption status. Common sources of messaging (see Figure 1) included:
- TV or radio (59%)
- print newspapers or magazines (25%)
- social media (25%)
Additional information on the awareness of education campaigns is available in the archived report.
Notes
- #: High sampling variability - although an estimate may be determined from the table, data should be suppressed
- Source: PAAHS 2023
Awareness of alcohol drinking guidelines
All respondents were asked about their awareness of "Canada's Low-Risk Alcohol Drinking Guidelines" (LRDG) or "Canada's Guidance on Alcohol and Health" (CGAH) (see Survey notes). The survey also asked people where they had first encountered alcohol drinking guidelines.
Overall, 59% of people were aware of the LRDG or CGAH (Figure 2). They most commonly reported hearing of them through:
- TV or radio (61%)
- print newspapers or magazines (12%)
- social media (8%)
Awareness of the guidelines was lowest among youth (40% of 16 to 19 year olds) and increased with age. Guideline awareness was also lower among former consumers of alcohol (50%). There was no meaningful difference by gender.
Notes
- #: High sampling variability - although an estimate may be determined from the table, data should be suppressed
- Source: PAAHS 2023
Knowledge of standard drink measurements
People who had never consumed alcohol (excluding occasional sips for religious or other purposes), did not participate in this section of the survey and are not included in this analysis.
First, respondents identified their typical alcoholic beverage of choice. Then, if they were familiar with the term "standard drink", they were shown an image of this beverage (Figure 3) and asked to determine the number of standard drinks in the container. The image displayed the container's volume and the beverage's percentage of alcohol by volume.
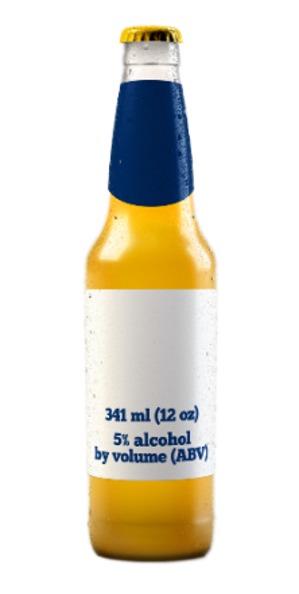
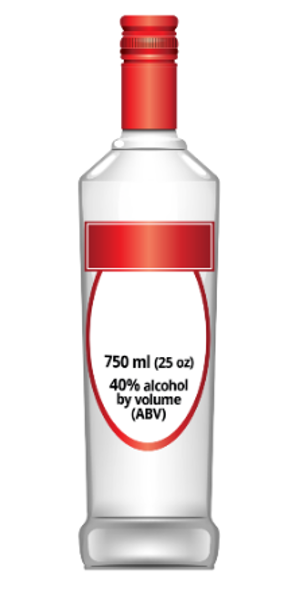
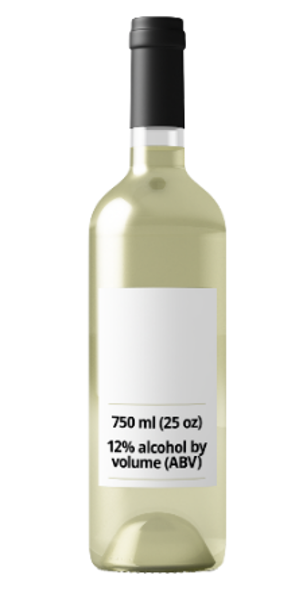
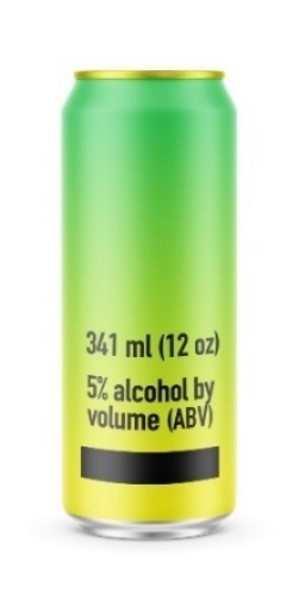
Text description
Alcohol containers displayed from left to right:
- Beer, 341 ml (12 oz), 5% alcohol by volume
- Spirits, 750 ml (25 oz), 40% alcohol by volume
- Wine, 750 ml (25 oz), 12% alcohol by volume
- Cider/cooler, 341 ml (12 oz), 5% alcohol by volume
Typical alcoholic beverage: When asked which alcoholic beverage they typically consumed, people replied:
- wine (43%)
- beer (28%)
- spirits (22%)
- cider or coolers (7%)
Wine was most popular among women (56%), while men favored beer (41%).
By age, younger people (16 to 19 years old and 20 to 24 years old) preferred beer and spirits, while older people (25 to 49 years old and those aged 50 years and older) preferred wine and beer.
By alcohol consumption status, consumers preferred wine and beer, while former consumers preferred wine and spirits.
Familiarity with "standard drink": 61% of people who had ever consumed alcohol were familiar with the term "standard drink". There were no meaningful differences by age or gender. Consumers (62%) were more familiar with the term than former consumers (48%).
Putting standard drinks into practice: Overall, 70% of those familiar with the term "standard drink" incorrectly determined the number of standard drinks in the image of their typical alcoholic beverage. This is despite being provided with the information necessary to calculate the answer. More results by specific beverage type are provided below. People familiar with the term "standard drink" were more accurate when their typical beverage came pre-portioned in a single-serving container, such as beer, cider or coolers.
- Beer: Among those shown the bottle of beer, 89% correctly determined that it contained 1.0 standard drink. Six percent (6%) of people estimated that it contained 2.0 standard drinks. The average response was 1.2 standard drinks, while the median was 1.0. Most people answered correctly, but for those who got it wrong, the tendency was to overestimate
- Spirits: Among those shown the bottle of spirits, 30% underestimated the number of standard drinks, and almost all (99%) failed to determine that it contained 17.6 standard drinks. Nearly half (48%) of people estimated 25.0 standard drinks. The average response was 22.1 standard drinks, while the median was 25.0
- Wine: Among those shown the bottle of wine, 58% underestimated the number of standard drinks, and almost all (99%) failed to determine that it contained 5.3 standard drinks. Most people were relatively close; common responses were 5.0 standard drinks (38%), 6.0 standard drinks (25%), and 4.0 standard drinks (16%). The average response was 6.3 standard drinks, while the median was 5.0
- Cider/coolers: Among those shown the can of cider or cooler, 61% correctly determined that it contained 1.0 standard drink. A quarter (25%) of people estimated 2.0 standard drinks. The average response was 1.5 standard drinks, while the median was 1.0. This indicates most people answered correctly but for those who got it wrong, the tendency was to overestimate
Due to small sample sizes, these results are not reported by gender, age or alcohol consumption status.
Perceptions of alcohol-related health risks
All respondents were asked about their perceptions of the impacts of different levels of alcohol consumption on their risk of 11 specific health conditions (Figure 4):
- arthritis
- diabetes
- liver disease
- colon cancer
- mouth cancer
- throat cancer
- heart disease
- breast cancer
- high cholesterol
- being overweight or obese
- harm to a fetus during pregnancy
Alcohol is known to increase the risk of all these health conditions except arthritis. Its effect on diabetes is complexFootnote 3.
Notes
- #: High sampling variability - although an estimate may be determined from the table, data should be suppressed
- Source: PAAHS 2023
General beliefs about alcohol and health conditions
People tended to believe that higher levels of alcohol consumption increased their risk for any of the listed health conditions. Similarly, they were more inclined to believe that low levels of alcohol consumption (1 to 2 standard drinks per week) had no impact on risk. Some people believe that alcohol decreases the risk of health conditions, especially at low levels of consumption. For example, 6% of people believed 1 to 2 standard drinks per week decreased their risk of heart disease.
People tended to believe that alcohol – regardless of the amount consumed – increased their risk for:
- harm to a fetus during pregnancy
- liver disease
- being overweight or obese
- diabetes
People were less likely to believe that alcohol increased their risk for:
- arthritis
- mouth cancer
- throat cancer
- breast cancer
Across all levels of consumption, roughly one-third of people weren't sure about the impact of alcohol on their risk of:
- high cholesterol
- colon cancer
- breast cancer
- throat cancer
- mouth cancer
- arthritis
Awareness of cancer risk
If a respondent already knew that alcohol increases the risk of breast, colon, throat, or mouth cancers, they were asked when they first became aware of this:
- more than a year ago (56%)
- in the last year (16%)
- in the last month (8%)
- in the last week (1%)
- didn't know (18%)
Most people who already knew of the increased risk of cancer from alcohol, reported that they first learned about it from:
- TV or radio (39%)
- print newspapers or magazines (13%)
- health care settings (10%)
- school (8%)
- non-social media websites (6%)
- social media (5%)
Notably, school was the first source of this information for many 16 to 19 year olds (34%) and 20 to 24 year olds (22%). TV or radio was the first source for a large proportion of 25 to 49 year olds (37%) and people aged 50 years and older (46%).
Awareness of risk by sex, age and alcohol consumption status
Awareness of risk associated with alcohol consumption differed by sex, age and alcohol consumption status. More female respondents than male respondents believed alcohol increased their risk of certain health conditions such as breast cancer or harm to a fetus during pregnancy. These differences between males and females were more pronounced for lower levels of consumption (1 to 2 or 3 to 6 standard drinks per week).
Youth were also more likely to believe that alcohol increases the risk of certain health conditions. For instance, 60% of 16 to 19 year olds believed that 1 to 2 standard drinks per week increases the risk of heart disease. This is in contrast to the proportion of other age groups with the same belief (51% of 20 to 24 year olds, 44% of 25 to 29 year olds, and 41% of those aged 50 years and older).
Similar patterns of awareness were observed for high cholesterol, liver disease, being overweight or obese, and harm to a fetus during pregnancy (Figure 4). Former consumers were more inclined than current consumers to believe 1 to 2 and 3 to 6 standard drinks per week increase the risk of health conditions. At higher levels of alcohol consumption (7+ standard drinks per week), perceptions of risk were similar across these groups.
Additional information on the awareness of risks is available in the archived report.
Health labelling of alcohol products
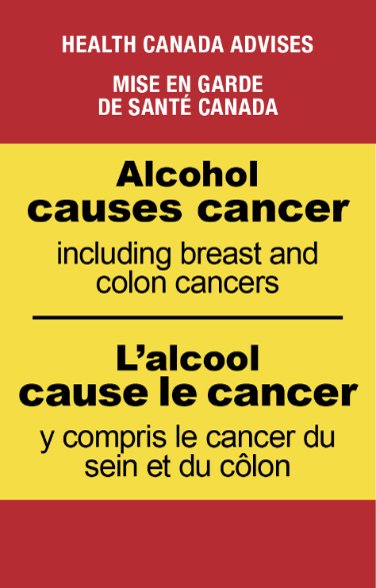
Text description
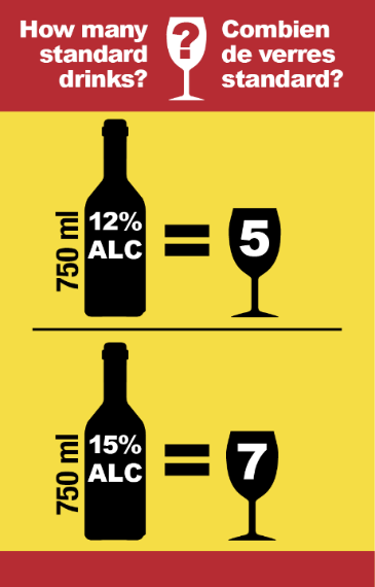
Images of labels displayed from left to right:
- Warning label: Health Canada advises that alcohol causes cancer, including breast and colon cancers
- Standard drinks label: 750 ml at 12% alcohol by volume equals 5 standard drinks, and 750 ml at 15% alcohol by volume equals 7 standard drinks
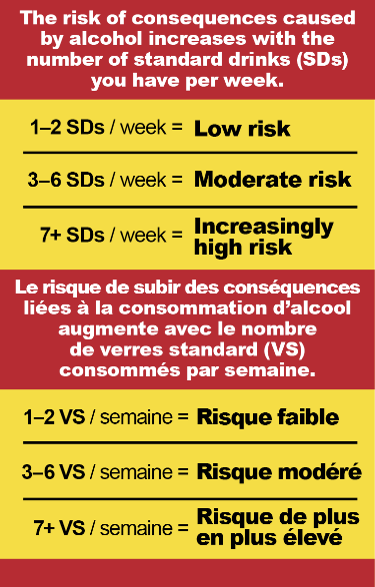
-
Risk label: The risk of consequences caused by alcohol increases with the number of standard drinks you have per week:
- 1 or 2 standard drinks per week is low risk
- 3 to 6 standard drinks per week is moderate risk
- 7 or more standard drinks per week is high risk
All respondents were asked a series of questions related to the health labelling of alcohol products.
Health warning labels and considering harms
Overall, 75% of people indicated a health warning label would make them think about the harms caused by alcohol. This increased slightly to 77% when they were shown an example warning label (Figure 5). While there were no meaningful differences by age, women and former consumers of alcohol were more likely to report that this labelling would make them think about harms to a large or extremely large extent.
Health warning labels and considering cutting back
Overall, 68% of people said that a warning label would make them think about cutting back on their own drinking or talk to others about cutting back on their drinking. This increased slightly to 72% when they were shown an example warning label (Figure 5). Women and former consumers were more likely to report that the label would make them do so to a large or extremely large extent.
Standard drink labels and tracking drinks
More than half of people (57%) said they would use a standard drink label (Figure 5) to help them track their consumption of alcohol. Youth 16 to 19 years (70%) were more likely than other age groups to say they would use this label. There were no meaningful differences by gender or alcohol consumption status.
Risk labels and considering cutting back
About three-quarters (74%) of people said that risk labels with drink limits (Figure 5) would make them think about cutting back on their own drinking or talk to others about cutting back on their drinking. Women and former consumers were more likely to report that the risk label would make them think about harms to a large or extremely large extent.
Support for the health labelling of alcohol products
For all health labelling questions, most people agreed or strongly agreed that alcohol should provide more labelling information (Figure 6). Specifically, they showed the greatest agreement for labels showing:
- the number of standard drinks (62%)
- guidance to reduce health risks (60%)
- health warnings (55%)
On the other hand, some people disagreed or strongly disagreed with labelling of alcohol, including:
- health warning labels (24%)
- risk labels (21%)
- standard drinks labels (19%)
More than half of people (59%) believed that alcohol should not be exempt from the health information labels required for other regulated products, such as tobacco and cannabis.
Additional information on the support for health labelling is available in the archived report.
Notes
- #: High sampling variability - although an estimate may be determined from the table, data should be suppressed
- Source: PAAHS 2023
Technical notes
Sex and gender
Recognizing that the risks, effects, influences, and consequences of alcohol use can vary based on biological sex and gender identity (see Survey notes), we use the terms:
- "female" and "male" when referring to sex-related results
- "women" and "men" when referring to gender-related results
Statistical considerations
Differences are reported when found to be statistically significant (pooled two proportion z test, where p≤0.05) with a non-trivial effect size (Cohen's h, where h≥0.2). This ensures that the results are both reliable (not due to chance) and meaningful (the difference has practical significance). To improve readability of the key findings, the term "statistically significant" is not repeated and the effect size is not reported. Where thresholds for significance and effect size are met, the difference between 2 estimates is referred to as "meaningful". At times, the findings say that differences are not meaningful even if the numbers are different. This means the difference lacks statistical and/or practical significance. Due to rounding or multiple responses, percentages may not always add up to 100.
Definitions
-
Alcohol consumption status:
- "Consumers" of alcohol are those who have consumed alcohol in the past 12 months
- "Former consumers" are those who have consumed alcohol in their lifetime but not in the past 12 months
- People who have never consumed alcohol are included in the overall sample but excluded from the analysis by alcohol consumption status, which focuses on consumers and former consumers
- Alcohol drinking guidelines: In 2011, the Canadian Centre on Substance Use and Addiction issued Canada's Low-Risk Alcohol Drinking Guidelines (LRDG)Footnote 2, designed to help people make informed decisions about alcohol. In 2023, the Centre updated and rebranded these guidelines as Canada's Guidance on Alcohol and Health (CGAH)Footnote 1, based on the latest research regarding alcohol-related risks. In this summary, "alcohol drinking guidelines" refer to both the LRDG and the CGAH. The questionnaire asked respondents about their awareness of either, without distinguishing between them (see Survey notes)
-
Standard drinkFootnote 1:
In Canada, a standard drink is 17.05 millilitres (ml) or 13.45 grams of pure alcohol. This is the equivalent of:
- a bottle of beer (12 oz., 341 ml, 5% alcohol)
- a bottle of cider (12 oz., 341 ml, 5% alcohol)
- a glass of wine (5 oz., 142 ml, 12% alcohol)
- a shot glass of spirits (1.5 oz., 43 ml, 40% alcohol)
-
Health labelling:
In this summary, "health labelling of alcohol products" refers to the potential addition of labelling information to show:
- the number of standard drinks
- guidance to reduce health risks
- health warnings
Survey notes
CGAH release
The Canadian Centre on Substance Use and Addiction released new drinking guidance with significant media attention in January 2023, shortly before the survey's launch on February 13, 2023. The timing of this release likely influenced respondents' awareness of alcohol drinking guidelines:
- Canada's Guidance on Alcohol and Health (CGAH, 2023)
- Canada's Low-Risk Alcohol Drinking Guidelines (LRDG, 2011)
The PAAHS did not distinguish between awareness of the LRDG and CGAH. Therefore, this survey offers a snapshot of awareness of alcohol drinking guidelines in general, following the CGAH release.
Sex and gender
To participate, respondents had to disclose their sex at birth to ensure a representative sample. They did not have to disclose their gender, although 75% chose to. This resulted in a larger sample for sex (n=9,812) compared to gender (n=7,398) in the analyses.
Data for transgender and non-binary respondents are not reported by gender as is done for men and women. This is because of the small sample size, a need to protect respondent anonymity, and to avoid poor quality estimates. Transgender and non-binary respondents are included in analyses of the sample overall and by age, sex and alcohol consumption status.
Overrepresentation of alcohol consumers
The PAAHS aimed to achieve a specific quota for alcohol consumption, where 75% of respondents reported consuming alcohol in the past 12 months and 25% had not consumed alcohol in the past 12 months. This quota was based on data from the 2019 Canadian Alcohol and Drug SurveyFootnote 4. Ultimately, 85% of the final sample reported having consumed alcohol in the past 12 months while 15% had not, indicating some overrepresentation of alcohol consumers. This may be due to volunteer bias, as the survey's title may have attracted people more interested in discussing alcohol-related topics because they consume alcohol.
Health literacy assessment
In the PAAHS sample, 20% of respondents were identified as having low or possibly low health literacy on the Canadian adaptation of the Newest Vital Sign health literacy assessment toolFootnote 5. Previous research estimates 60% of Canadians have low levels of health literacyFootnote 6. Estimates for the overall sample should be interpreted with caution as people with adequate health literacy are overrepresented. For results by health literacy, please refer to the archived report.
Acknowledgements
The Public Awareness of Alcohol-related Harms Survey (PAAHS) was conducted by Nanos Research on behalf of Health Canada.
References
- Footnote 1
-
Paradis, C., Butt, P., Shield, K., Poole, N., Wells, S., Naimi, T., Sherk, A., & the Low-Risk Alcohol Drinking Guidelines Scientific Expert Panels. (2023). Canada's Guidance on Alcohol and Health: Final Report. Ottawa, Ont.: Canadian Centre on Substance Use and Addiction.
- Footnote 2
-
Butt, P., Beirness, D., Gliksman, L., Paradis, C., & Stockwell, T. (2011). Alcohol and health in Canada: A summary of evidence and guidelines for low-risk drinking. Ottawa, Ont.: Canadian Centre on Substance Abuse.
- Footnote 3
-
Shield, Kevin D., Charles Parry, and Jürgen Rehm. "Chronic diseases and conditions related to alcohol use." Alcohol research: current reviews 35.2 (2014): 155.
- Footnote 4
-
Health Canada. (2019). Canadian alcohol and drugs survey (CADS): Summary of results for 2019. Accessed 2023-08-29.
- Footnote 5
-
Mansfield, E. D., Wahba, R., Gillis, D. E., Weiss, B. D., & L'Abbé, M. (2018). Canadian adaptation of the Newest Vital Sign©, a health literacy assessment tool. Public health nutrition, 21(11), 2038-2045.
- Footnote 6
-
Health Literacy in Canada: A Healthy Understanding 2008 (Ottawa: 2008). page 10. Accessed 2023-08-29.
You might also be interested in

Canadian Postsecondary Education Alcohol and Drug Use Survey, 2021/2022
The Canadian Postsecondary Education Alcohol and Drug use Survey (CPADS) contributes to Health Canada’s substance use surveillance strategy, which provides the Government of Canada with vital information on the use of drugs and other substances by Canadians.
Alcohol use among Canadians
Trends of alcohol use among Canadians 15 years of age and older from the Canadian Tobacco, Alcohol and Drugs Survey (CTADS) and the Canadian Alcohol and Drug Use Monitoring Survey (CADUMS).
- Date modified: